School sky light project
Many weather events are signalled by changes in sky brightness.When the sky darkens quickly, people know to take cover from impending rain. Today, it is easy to make cheap devices to measure sky brightness, and this website explains how a network of such devices could be built and networked by schoolchildren. This opens up many educational opportunities for students with a wide range of interests, and students would be motivated by hearing of their work in weather reports.
Results
See also: introduction and methods.
Weather
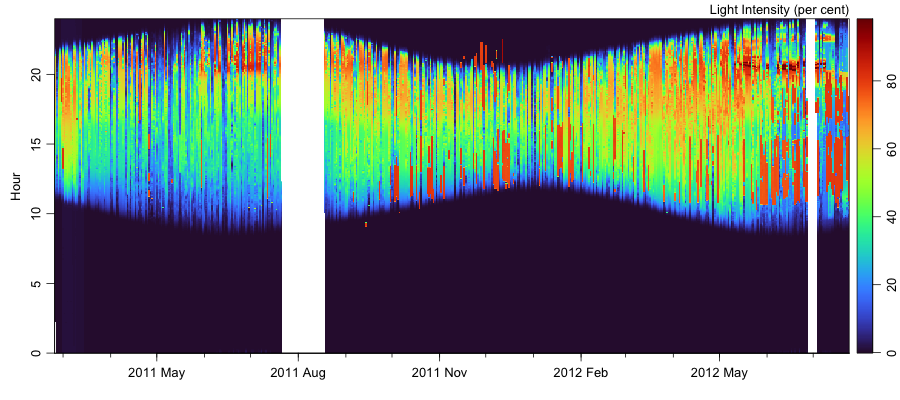
The graph shown below indicates recent variations in light intensity in an office in Halifax, Nova Scotia. The sensor is placed on a desk, pointing upwards, and shaded from direct sunlight. The (rare) use of lights in the office is indicated by near-constant light levels of 80 percent.

The image is color-coded for intensity and shown as a function of the hour of the day and the day of the year. It is created at a 10-minute interval with the R script weather_image.R. The white regions of the image correspond to times when the sensor was disconnected from the logging computer.
Solar navigation
A couple of days of clear sunrise and sunset can be sufficient to navigate infer an observation location to within a few hundred kilometers (see Section 5.9 of Kelley, Dan E. Oceanographic Analysis with R. New York: Springer-Verlag,
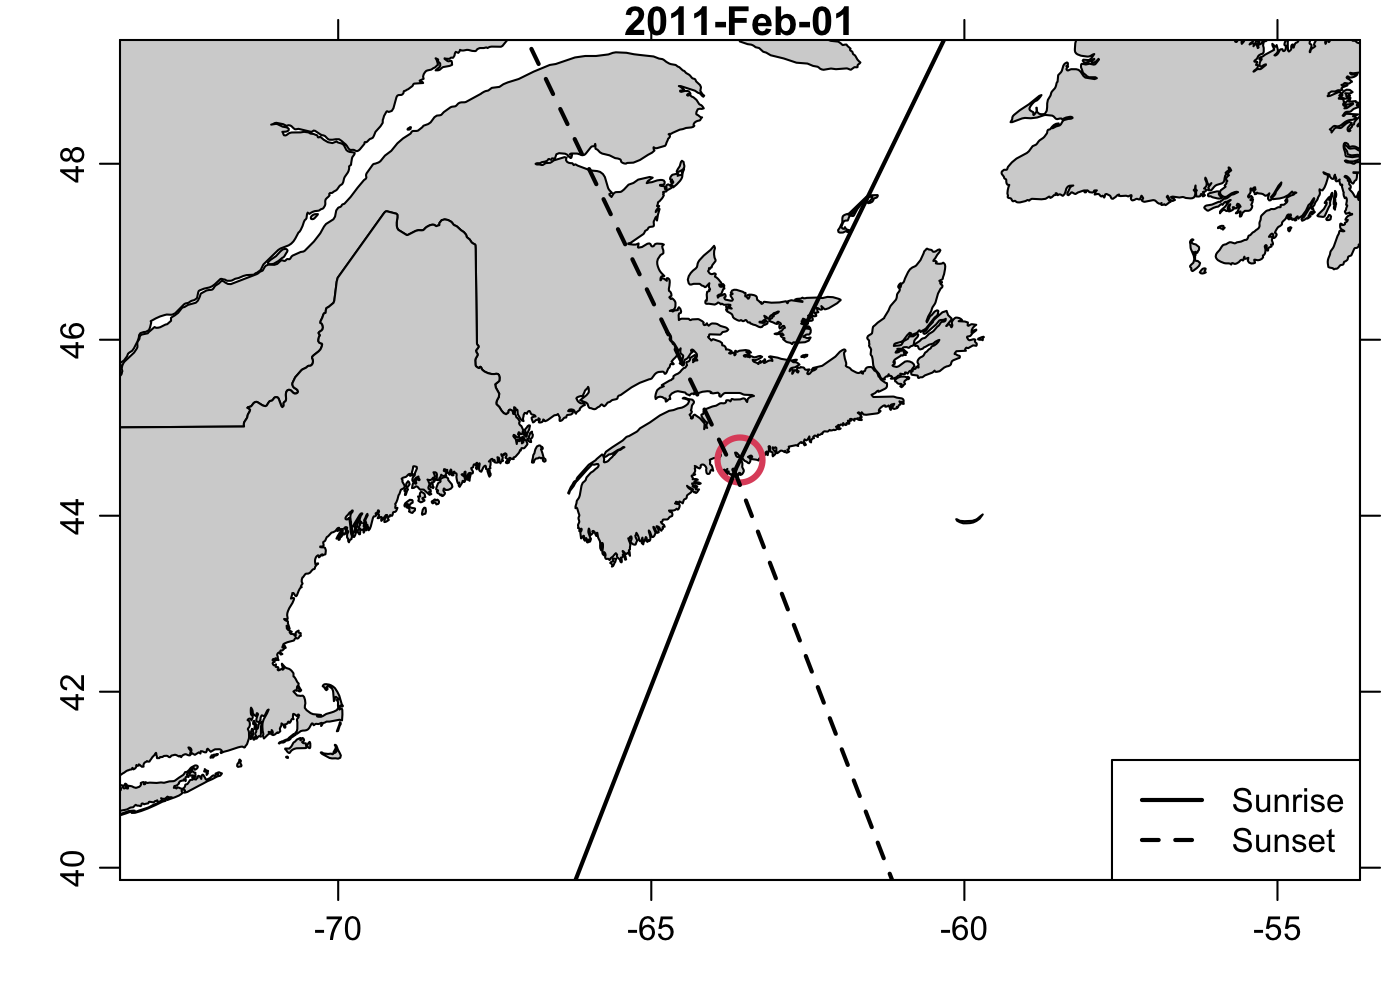
- https://www.springer.com/us/book/9781493988426). Even the shade-affected observations made in author's office can provide a reasonable estimate, if a longer time interval is used, as illustrated below.

The graph shown above indicates the observation location in Halifax, Nova Scotia with a circle, along with an inference of that location based on sunrise and sunset times (intersection of solid and dashed curved lines). It is made with an R script called solar_navigation.R.
Sensor calibration
The graph below shows a calibration between two sensors placed near each other. It seems reasonable to take the main shape as a measure of inter-sensor differences, although the detailed trajectories in the calibration space may also relate to differences in light intensity at the two sensors, since they are nestled between various bits of equipment on a table, and one is sometimes in brighter light than the other, as light passes through the room through the course of the day. The graph is created by an R script called calibration.R.
