Introduction
The base R system provides lapply() and related functions, and the package plyr provides alternatives that are worth considering. It will be assumed that readers are familiar with lapply() and are willing to spend a few moments reading the plyr documentation, to see why the illustration here will use the ldply() function.
The test task will be extraction of latitude (and then both latitude and longitude) from the section dataset in the oce package. (Users of that package may be aware that there is a built-in accessor for doing this, so results can easily be checked.)
Methods
First, load the data
1
2
library(oce)
data(section)
Next, find latitudes using lapply
1
lat <- unlist(lapply(section[["station"]], function(x) x[["latitude"]]))
Next, find latitudes with ldply
1
2
library(plyr)
lat <- ldply(section[["station"]], function(x) x[["latitude"]])
Results
The reader can check that the results match, although ldply() returns a data frame, not a vector as in the first method. Tests of speed
1
2
3
library(microbenchmark)
microbenchmark(ldply(section[["station"]], function(x) x[["latitude"]])$V1,
    unlist(lapply(section[["station"]], function(x) x[["latitude"]])))
yield the following
1
2
3
4
5
6
7
## Unit: milliseconds
##                                                               expr   min
##        ldply(section[["station"]], function(x) x[["latitude"]])$V1 18.99
##  unlist(lapply(section[["station"]], function(x) x[["latitude"]])) 18.36
##     lq median    uq   max neval
##  20.26  20.56 21.02 36.05   100
##  19.71  19.93 20.64 63.18   100
suggesting a difference too small to be of much practical interest.
Discussion
Since ldply() returns a data frame, it is more flexible than unlist(), which returns a vector. For example, the following creates a data frame with columns for lat and lon:
1
latlon <- ldply(section[["station"]], function(x) c(x[["latitude"]], x[["longitude"]]))
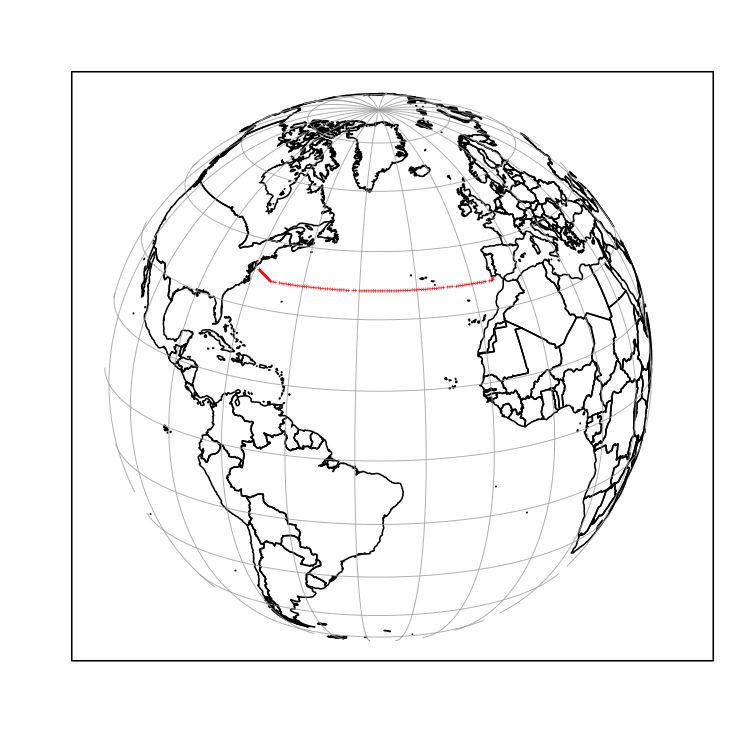
A station plot is produced as follows.
1
2
3
mapPlot(coastlineWorld, projection = "orthographic", orientation = c(20, -40,
    0))
mapPoints(latlon$V2, latlon$V1, pch = "+", cex = 1/2, col = "red")
Conclusions
The effort of learning how to use the plyr package is likely to pay off in more flexible code, particularly because of the use of data frames in that package. On this theme, note that the author of plyr is developing a similar package called dplry, which centres more closely on data frames and offers many new features; see http://blog.rstudio.org/2014/01/17/introducing-dplyr/ for a blog item introducing dplyr.