Plot longitude and latitude grid on an existing map. This is an
advanced function, requiring coordination with mapPlot() and
(possibly) also with mapAxis(), and so it is best avoided by
novices, who may be satisfied with the defaults used by
mapPlot().
Arguments
- dlongitude
increment in longitude, ignored if
longitudeis supplied, but otherwise determines the longitude sequence.- dlatitude
increment in latitude, ignored if
latitudeis supplied, but otherwise determines the latitude sequence.- longitude
numeric vector of longitudes, or
NULLto prevent drawing longitude lines.- latitude
numeric vector of latitudes, or
NULLto prevent drawing latitude lines.- col
color of lines
- lty
line type
- lwd
line width
- polarCircle
a number indicating the number of degrees of latitude extending from the poles, within which zones are not drawn.
- longitudelim
optional argument specifying suggested longitude limits for the grid. If this is not supplied, grid lines are drawn for the whole globe, which can yield excessively slow drawing speeds for small-region plots. This, and
latitudelim, are both set bymapPlot()if the arguments of the same name are passed to that function.- latitudelim
similar to
longitudelim.- debug
a flag that turns on debugging. Set to 1 to get a moderate amount of debugging information, 2 to go two function levels deep, or 3 to go all the way to the core functions. Any value above 3 will be truncated to 3.
Value
A data.frame, returned silently, containing
"side", "value", "type", and "at".
A default call to mapPlot() ensures agreement of grid and axes by using
this return value in a call to mapAxis().
Details
This is somewhat analogous to grid(), except that the first two
arguments of the latter supply the number of lines in the grid,
whereas the present function has increments for the first two
arguments.
See also
A map must first have been created with mapPlot().
Other functions related to maps:
formatPosition(),
lonlat2map(),
lonlat2utm(),
map2lonlat(),
mapArrows(),
mapAxis(),
mapContour(),
mapCoordinateSystem(),
mapDirectionField(),
mapImage(),
mapLines(),
mapLocator(),
mapLongitudeLatitudeXY(),
mapPlot(),
mapPoints(),
mapPolygon(),
mapScalebar(),
mapText(),
mapTissot(),
oceCRS(),
oceProject(),
shiftLongitude(),
usrLonLat(),
utm2lonlat()
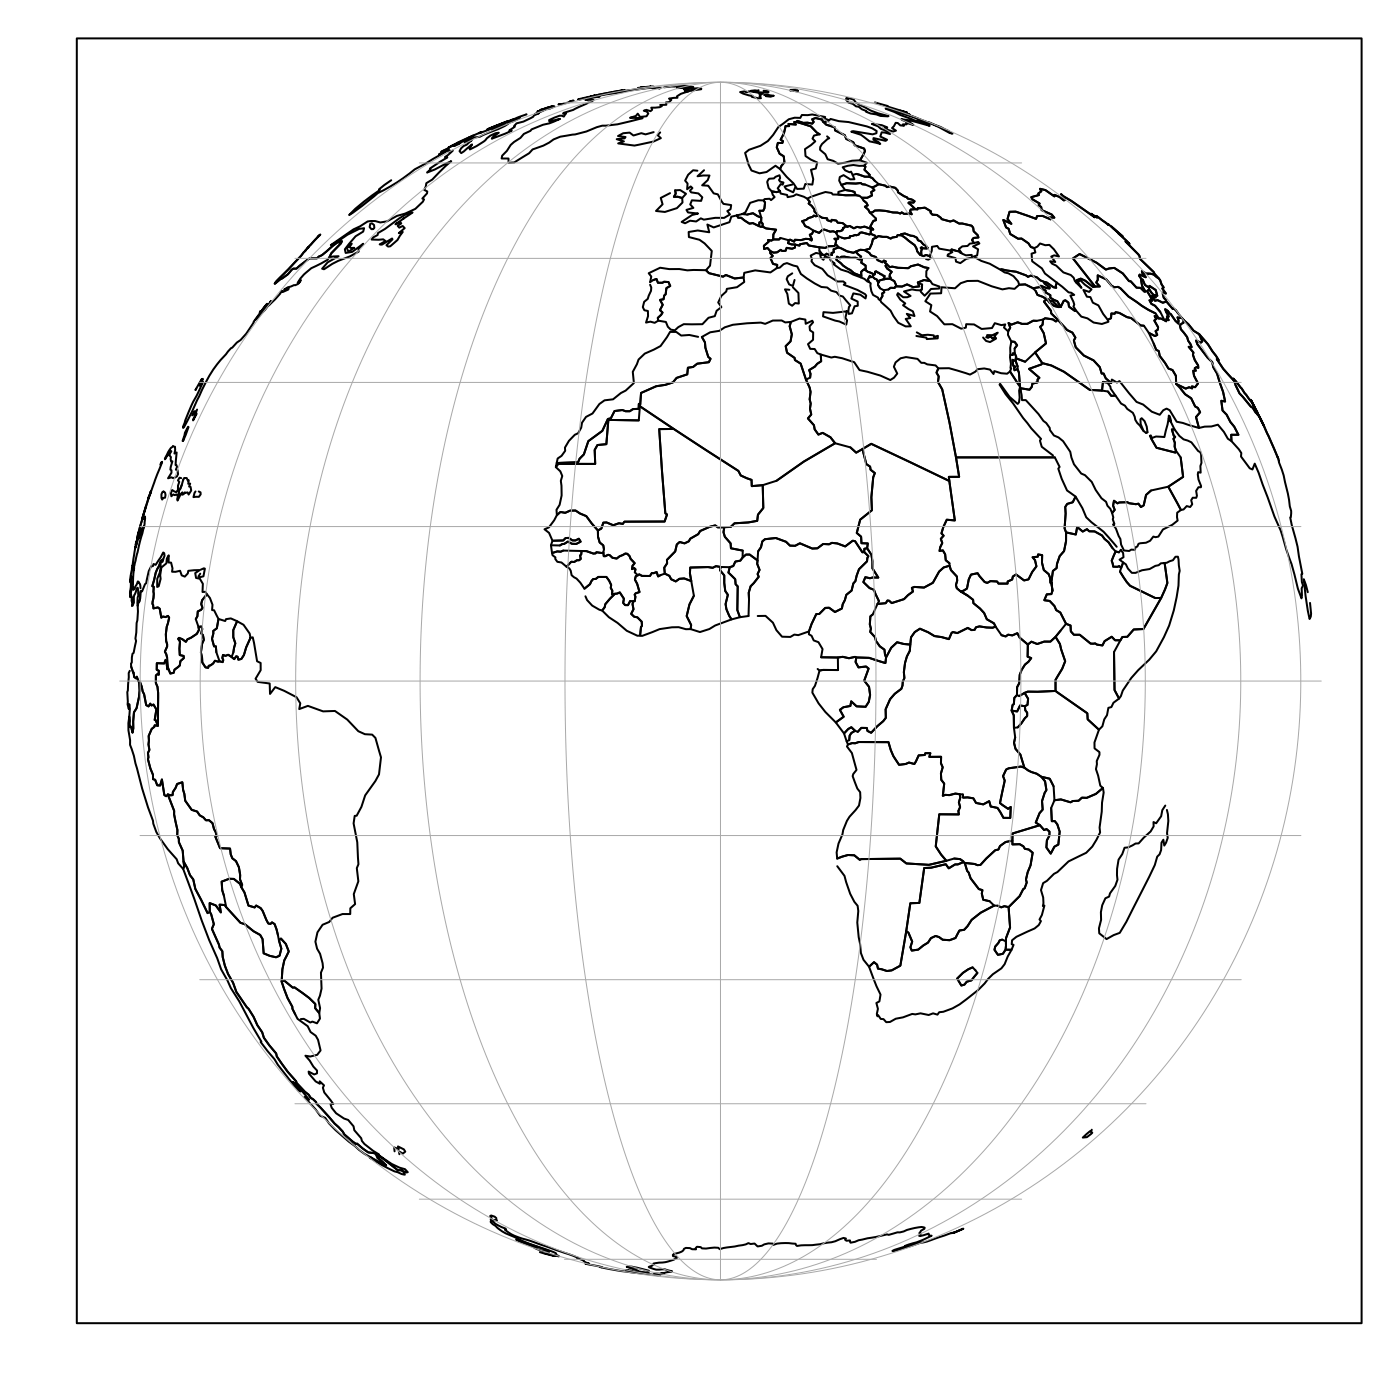
Examples
# \donttest{
if (utils::packageVersion("sf") != "0.9.8") {
    # sf version 0.9-8 has a problem with this projection
    library(oce)
    data(coastlineWorld)
    par(mar = c(2, 2, 1, 1))
    # In mapPlot() call, note axes and grid args, to
    # prevent over-plotting of defaults.
    mapPlot(coastlineWorld,
        type = "l", projection = "+proj=ortho",
        axes = FALSE, grid = FALSE
    )
    mapGrid(15, 15)
}

# }
# }