colormap
Apr 30, 2014
A proposed colormap() function for oce is illustrated.
Introduction
Over the past month or so I have been trying different ways of handling GMT-style colormaps in Oce. I think my present solution is on the right track, but I am posting here to get more eyes on the problem.
Note that, prior to 2014-04, there were different versions for colormap().
Procedure
The following code is direct from the help for Colormap(); all I’ve done is to put the example code into Rmarkdown to make for easier comparison with the resultant graphs.
1
library(oce)
## Loading required package: methods
## Loading required package: mapproj
## Loading required package: maps
1
2
3
4
5
6
7
8
9
10
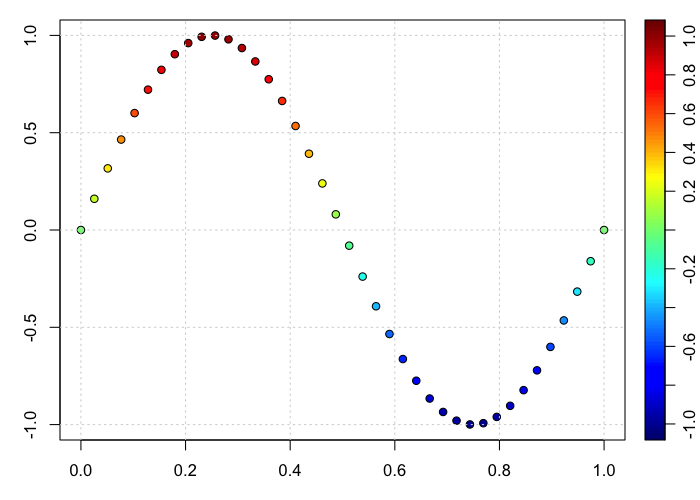
## Example 1. color scheme for points on xy plot
x <- seq(0, 1, length.out=40)
y <- sin(2 * pi * x)
par(mar=c(3, 3, 1, 1))
mar <- par('mar') # prevent margin creep by drawPalette()
## First, default breaks
c <- colormap(y)
drawPalette(c$zlim, col=c$col, breaks=c$breaks)
plot(x, y, bg=c$zcol, pch=21, cex=1)
grid()
1
2
3
4
5
6
par(mar=mar)
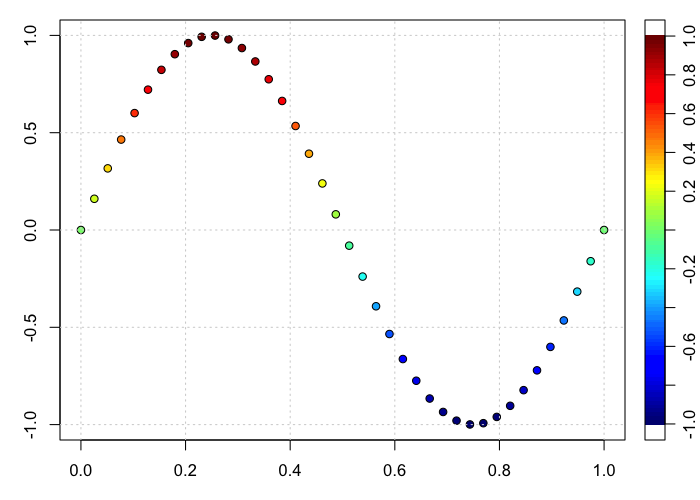
## Second, 100 breaks, yielding a smoother palette
c <- colormap(y, breaks=100)
drawPalette(c$zlim, col=c$col, breaks=c$breaks)
plot(x, y, bg=c$zcol, pch=21, cex=1)
grid()
1
2
3
4
5
6
7
par(mar=mar)
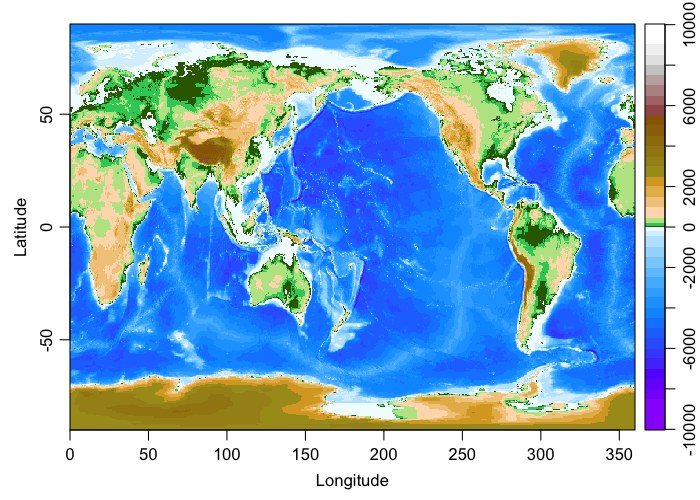
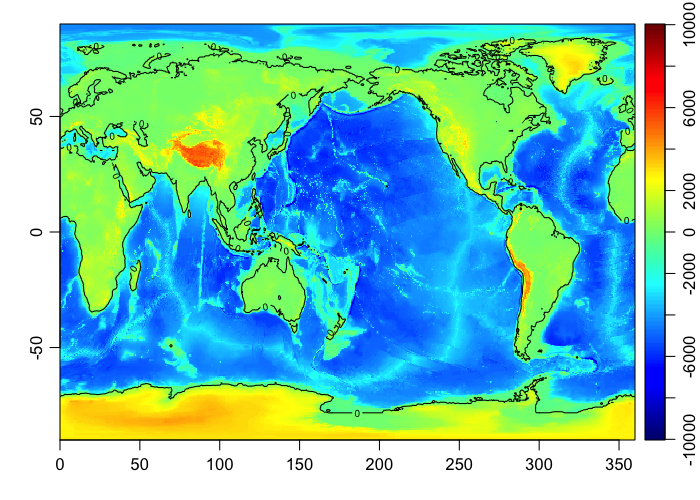
## Example 2. topographic image with a standard color scheme
par(mfrow=c(1,1))
data(topoWorld)
cm <- colormap(name="gmt_globe")
imagep(topoWorld, breaks=cm$breaks, col=cm$col)
1
2
3
4
5
6
7
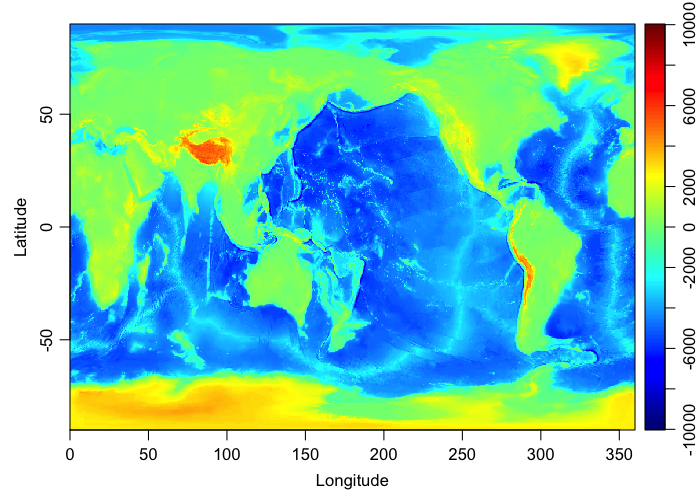
## Example 3. topographic image with modified colors
cm <- colormap(name="gmt_globe")
deep <- cm$x0 < -4000
cm$col0[deep] <- 'black'
cm$col1[deep] <- 'black'
cm <- colormap(x0=cm$x0, x1=cm$x1, col0=cm$col0, col1=cm$col1)
imagep(topoWorld, breaks=cm$breaks, col=cm$col)
1
2
3
4
5
6
7
8
9
## Example 4. image of world topography with water colorized
##            smoothly from violet at 8km depth to blue
##            at 4km depth, then blending in 0.5km increments
##            to white at the coast, with tan for land.
cm <- colormap(x0=c(-8000, -4000, 0, 100),
               x1=c(-8000, -4000, 0, 100),
               col0=c("violet","blue","white","tan"),
               col1=c("violet","blue","white","tan"),
               n=c(100, 8, 1))
## Warning: the condition has length > 1 and only the first element will be
## used
## Error: 'con' is not a connection1
2
3
4
5
lon <- topoWorld[['longitude']]
lat <- topoWorld[['latitude']]
z <- topoWorld[['z']]
imagep(lon, lat, z, breaks=cm$breaks, col=cm$col)
contour(lon, lat, z, levels=0, add=TRUE)
Resources
- Source code: 2014-04-30-colormap.R